...
概要
GISバブルマップは、GISポイントを使用してバブル位置を指定し、マップへの詳細追加に使用できるGISレイヤー、およびWMSレイヤーにそれらを対応させます。GISバブルマップはバブルグラフの高度な形式で、GISポイントを使用してバブル位置を指定し、詳細をマップに追加するために使用できるGISレイヤーとWMSレイヤーにそれらを対応させます。
グラフデータオプション
...
...
...
...
WMSレイヤーの追加
| Section |
|---|
| Column |
|---|
| 1. 背景として使用されるマップにWMSレイヤーを追加します。 2. 「 Image Removed レイヤーの追加」リンクをクリックします。 Image Removed レイヤーの追加」リンクをクリックします。 3. 「WMSレイヤー」タブを選択し、「WMS – 海岸、陸地、海レイヤー」をクリックします。 4. 以前のマップと同様に、「GIS World Backgroundレイヤー」を追加します。 |
| Column |
|---|
|  Image Removed Image Removed
|
|
| Section |
|---|
| Column |
|---|
| 5. グラフは次のように表示されます。必要な情報が追加されましたが、これでは見た目が良くありません。 6. WMSレイヤーを背景の上位にし、白を半透明に変更する必要があります。 |
| Column |
|---|
|  Image Removed Image Removed
|
|
| Section |
|---|
| Column |
|---|
| 7. シリーズ設定内のヘッダーバーの右側をクリックしてWMSレイヤーをドラッグし、背景レイヤーの上位に配置します。 |
| Column |
|---|
|  Image Removed Image Removed
|
|
| Section |
|---|
| Column |
|---|
| 8. 「半透明」色を「白(#FFFFFF)」に変更します。 9. 「ズームレベル」を「3」から「0」に設定します。これにより、このレイヤーは2回ズームインしたときにだけ表示されます。 10. 「更新」をクリックして、更新したグラフを表示します。  Image Removed Image Removed
|
| Column |
|---|
|  Image Removed Image Removed
|
|
| Section |
|---|
| Column |
|---|
| 11. これで図に示すようなグラフが作成されました。 12. ナビゲーションを使用してズームインおよびズームアウトしたり、バブルサイズとして表示するため異なるシリーズを選択したりできます。 13. グラフを保存して閉じます。 |
| Column |
|---|
|  Image Removed Image Removed
|
|
...
...
1.「作成」リンクをクリックして、「レポート」を選択しレポートの作成を開始します。
| Column |
|---|
|
 Image Removed Image Removed
|
| Section |
|---|
| Column |
|---|
| 2.「新規レポート作成」ページが表示されます。レポートの作成方法として、「ドラッグ&ドロップビルダー」を選択します。 |
| Column |
|---|
|  Image Removed Image Removed
|
|
| Section |
|---|
| Column |
|---|
| 3.ビューとして「Ski Team」を選択します。 4. 「 Image Removed」ボタンをクリックして次に進みます。 Image Removed」ボタンをクリックして次に進みます。 |
| Column |
|---|
|  Image Removed Image Removed
|
|
| Section |
|---|
| Column |
|---|
| 5. 「Athlete」カテゴリーから「Athlete ID」、「First Name」、「Last Name」、および「Demographic」をドラッグします。 6. 「Athlete Location」カテゴリーから「Athlete Geo Point」をドラッグします。 7. メトリックをドラッグします。この例では、「Invoice (Pref Currency)」が合計、最大、平均として3つ使用されています。 8. 表示が「グラフのみ」に設定されていることを確認します。 9. 「Image Removed次へ」をクリックして続行します。 |
| Column |
|---|
|  Image Removed Image Removed
|
|
| Section |
|---|
| Column |
|---|
| 10. 表示ページで、グラフアイコンをクリックしてグラフを編集し、設定します。 |
| Column |
|---|
|  Image Removed Image Removed
|
|
| Section |
|---|
| Column |
|---|
| 11. 「グラフ」メニューから「マップ」を選択します。次に、「GISバブルマップ」タイプを選択します。「保存」をクリックして選択を完了します。  Image Removed Image Removed
|
| Column |
|---|
|  Image Removed Image Removed
|
|
| Section |
|---|
| Column |
|---|
| 12. 「グラフデータ」セクションがGISマップに関連するフィールドで更新されたことがわかります。 13. 次を選択してください: GISフィールド:Athlete Geo Point
メトリック:Sum Invoice (Pref Currency)
色:Demographic
ラベル:Athlete ID、First Name、Last Name 14. 「更新」をクリックして、グラフを表示します。 Image Removed |
| Column |
|---|
|  Image Removed Image Removed
|
|
| Section |
|---|
| Column |
|---|
| 15. 「グラフの書式」オプションで、「シリーズ選択を表示」を選択し、「Hoverナビゲーション」をオンにして、色を青に設定します。 16. 「保存」をクリックしてグラフを更新します。 Image Removed |
| Column |
|---|
|  Image Removed Image Removed
|
|
| Section |
|---|
| Column |
|---|
| 17. これでグラフは次のように表示されます。 |
| Column |
|---|
|  Image Removed Image Removed
|
|
| サイズ | マップ上のバブルサイズを指定するメトリック(数値)フィールドです。 |
| 色 | バブルに色を表示するディメンション(次元)、またはメトリック(数値)フィールドです。 |
| ツールチップ | ツールチップに表示される値です。 |
...
手順
データセットを使用して、GISバブルマップを作成するには、以下の手順に従います。
- 「作成」ボタンをクリックして、「レポート」を選択し、レポート作成を開始します。
 Image Added
- グラフ作成に使用する、GISデータを含むビューを選択します。今回の例では、スキーチームデータを使用します。
 Image Added
- レポートビルダー画面で、GISやメトリック(数値)フィールドを含む必要なデータを、レポートに追加します。今回の例では、Geo Point(顧客)、請求金額フィールドを使用します。
ジオポイントや、ジオポリゴンデータを元の形式で表示するには、以下の手順に従います。
- 「グラフ」画面へ移動し、「グラフの選択」を展開します。マップ項目から、「GISバブルマップ」を選択します。
 Image Added
- GISマップの作成に必要なフィールドをドラッグします。例えば、今回の例では、Geo Point(顧客)フィールドをジオフィールド項目にドラッグし、コンポーネントのサイズを指定するメトリック(数値)を選択します。すべての項目の説明については、上記グラフデータオプションを参照してください。
- GISバブルマップが表示されます。メトリック(数値)フィールドの値の基づき、バブルのサイズが指定されます。
 Image Added
- 上図の例は、位置情報を明示する、GISバブルマップのデフォルトの背景イメージ(世界地図)を表示しています。
- マップの設定から、このイメージを非表示にすることができます。以下2つの方法で、これを実行できます。
- 「グラフ設定」をクリックし、「スタイル」項目を展開して、「GISベースレイヤー」トグルを無効にします。
- 「管理」>「コンテンツ設定」>「グラフ設定」へ移動し、「マップの設定」項目を展開して、「GISベースレイヤー」トグルを無効にします。
- 「グラフ設定」から、GISバブルマップに書式を設定することができます。より詳細な情報は、グラフの書式を参照してください。
- または、マップにレイヤーを追加できます。以下に、その手順を示します。
- 設定が完了したら、マップを保存します。
WMSを使用した背景の追加
WMSレイヤーを追加して、ジオマップの背景に使用することができます。
Before you begin, ensure that you have added one or more WMS images to the system. See here for how to.
- Click on the GIS Setting button in the chart builder.
- Click on the Add Layer button when the popup window appears.
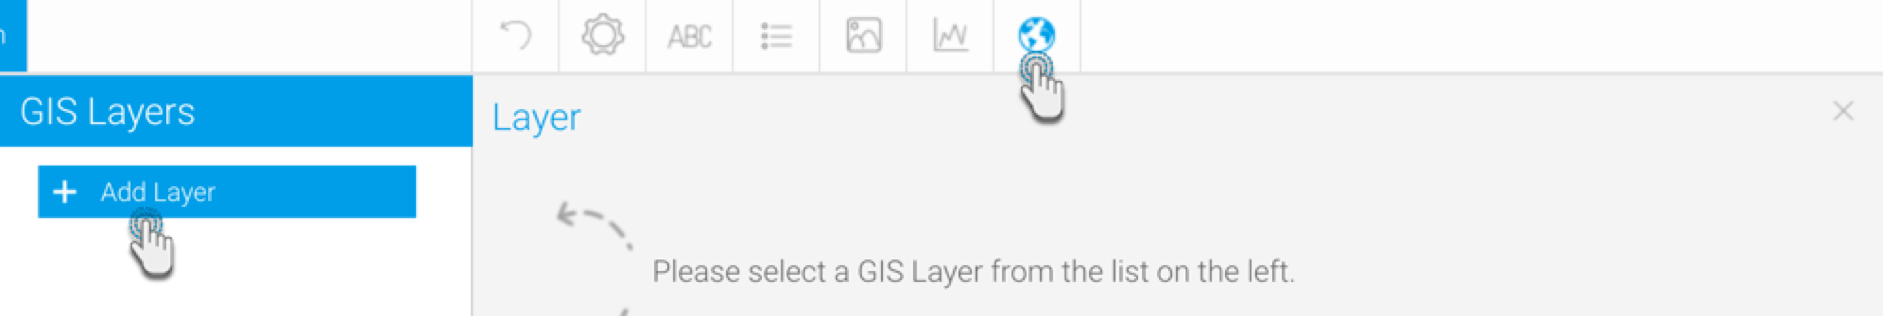 Image Added
- In the new Search popup window, click on the WMS Layer tab.
- All WMS layers added will be visible here. Select one to be added to the map from the result list.
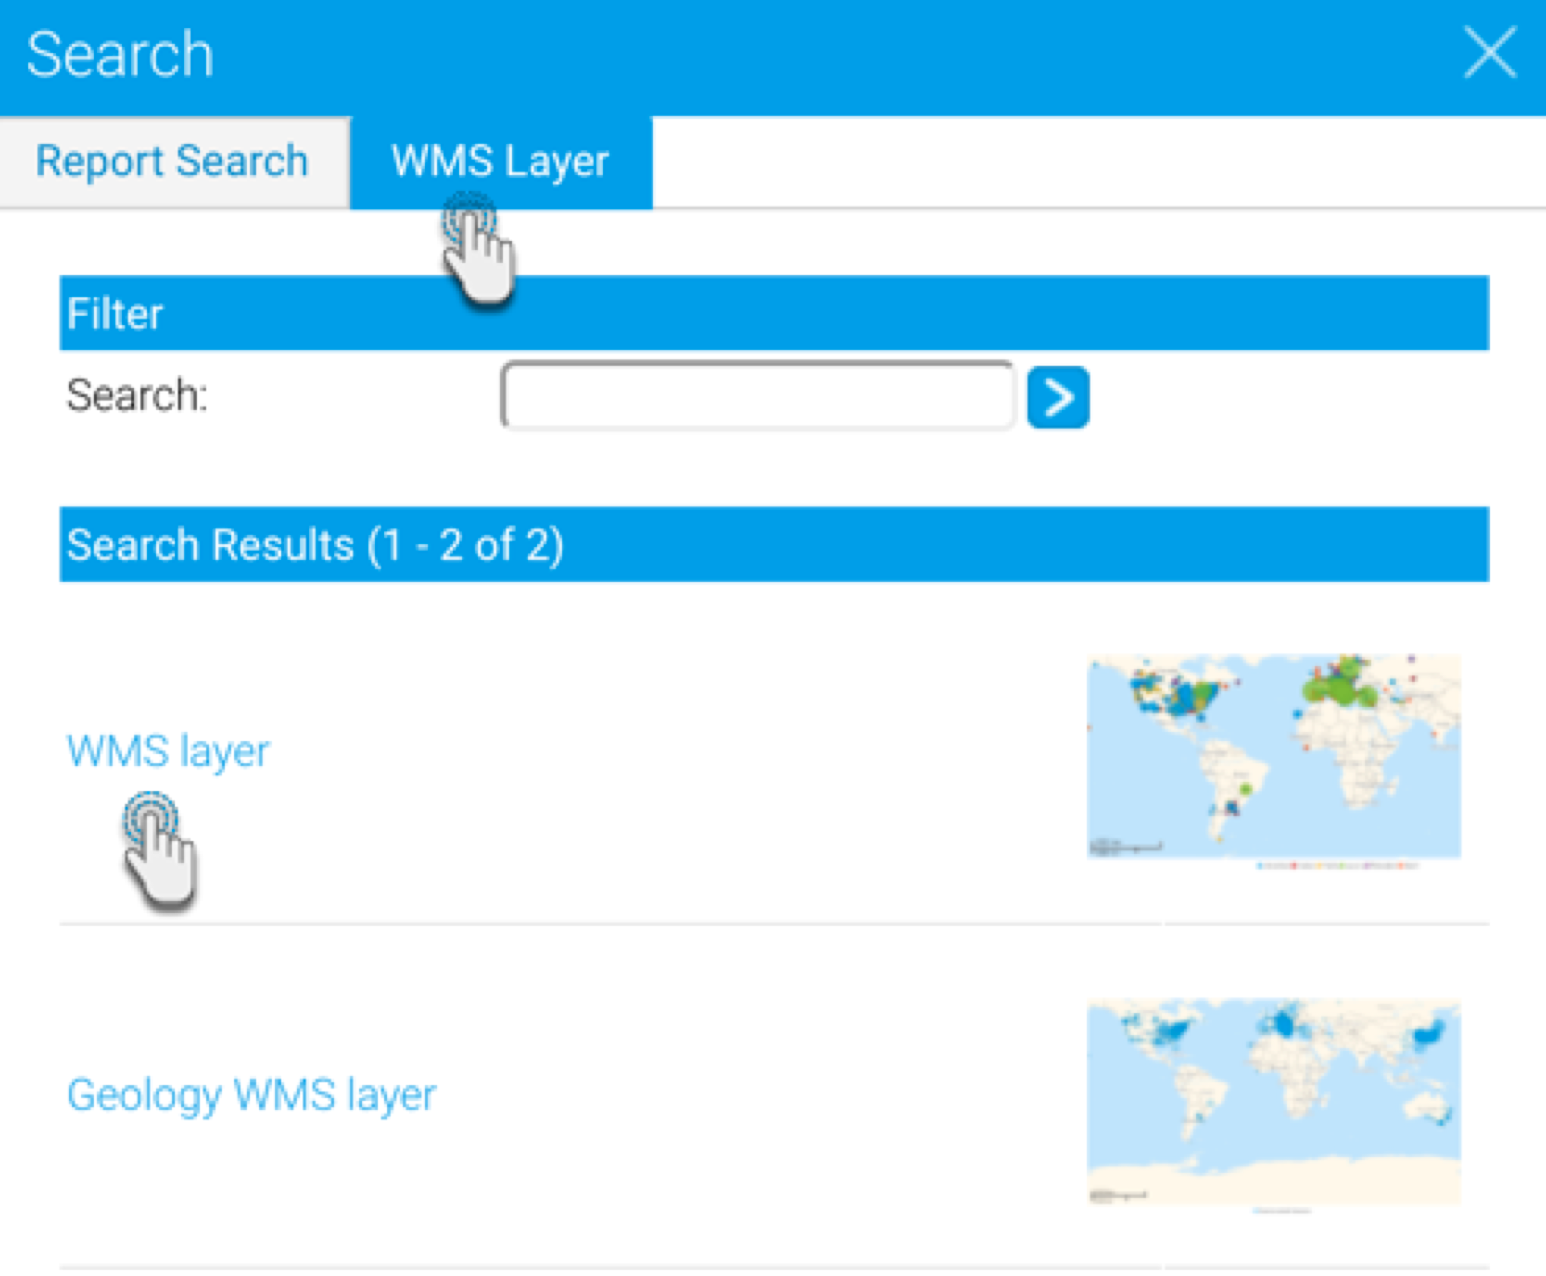 Image Added
- Next, the layer settings page will appear. If the layer doesn’t look the way you want it to, use the settings here to make changes. You can learn more about the function of each setting in our wiki section here.
- For example, below is our chart with the layer. As you can see, the layer is displayed above the map.
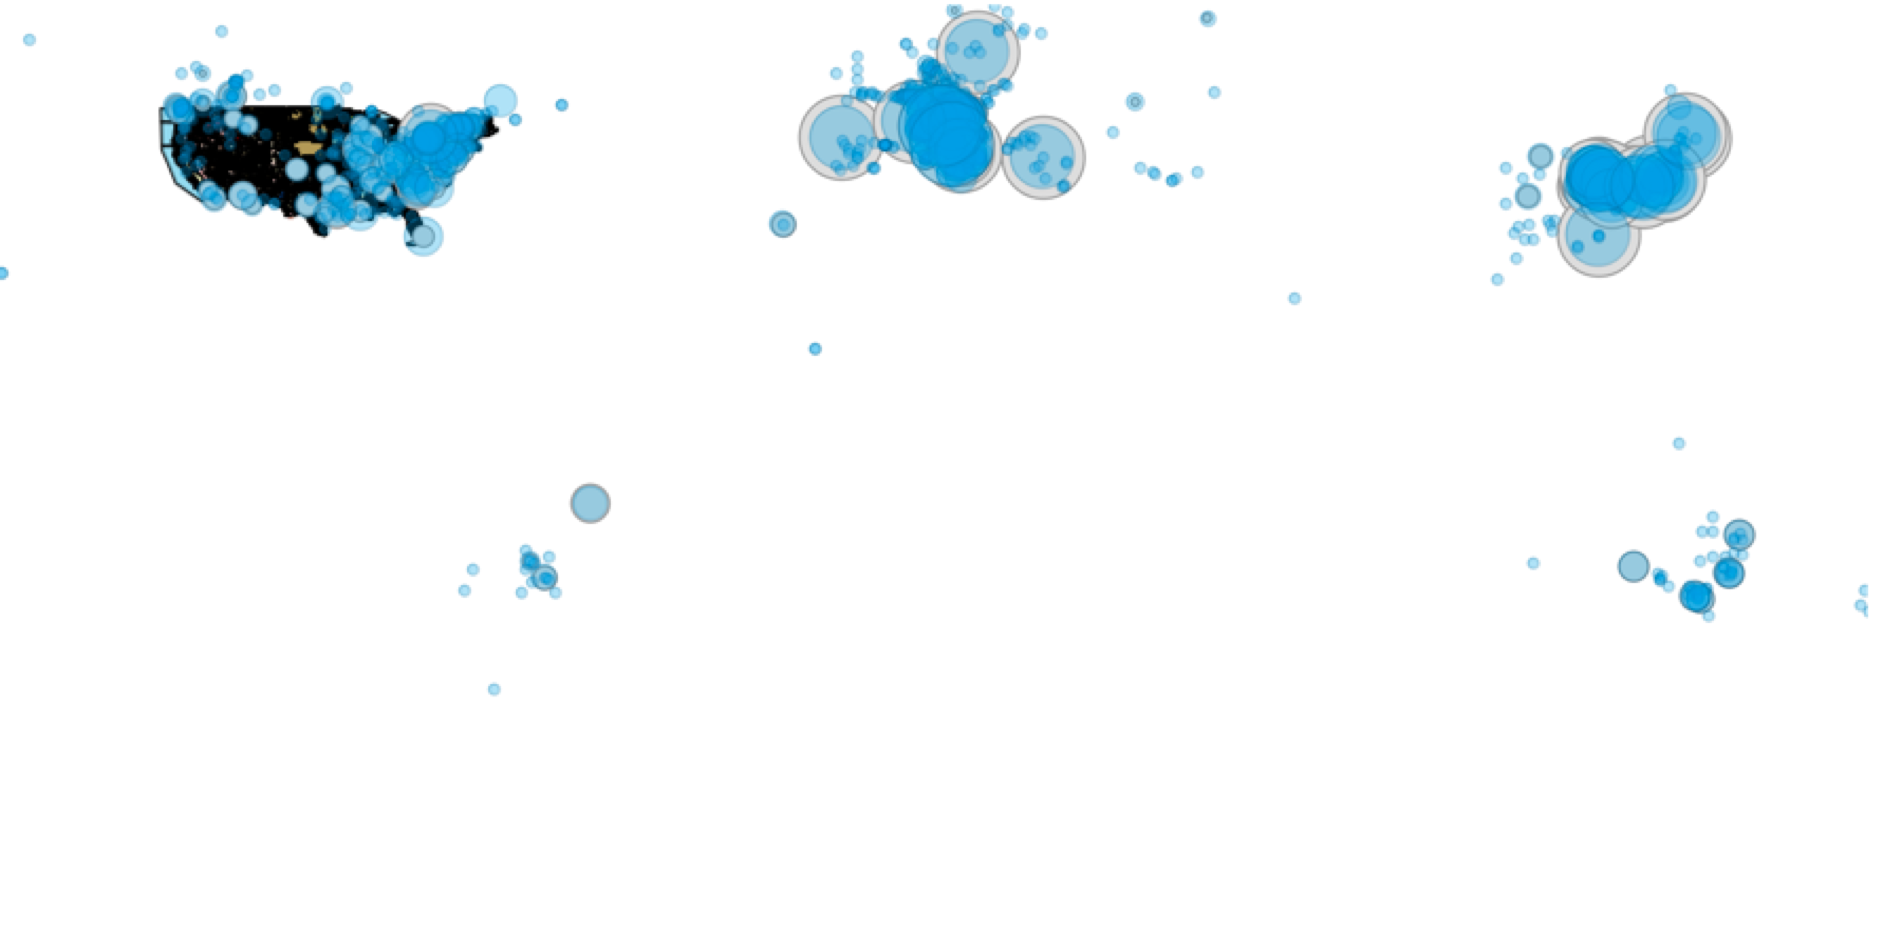 Image Added
- This can be changed, by going into the layer settings, and disabling the Foreground toggle.
 Image Added
- The layer will be set behind the map.
- Once you’re done, your chart should have a layer with additional information over your map.
- Save and close your chart.


